Homelabbing: Building a Mini PC Observability Platform, One Weekend at a Time
How an app-of-apps pattern, a dual-ingress topology, and multi-window burn-rate alerts turn a single mini PC into a production-grade platform laboratory.
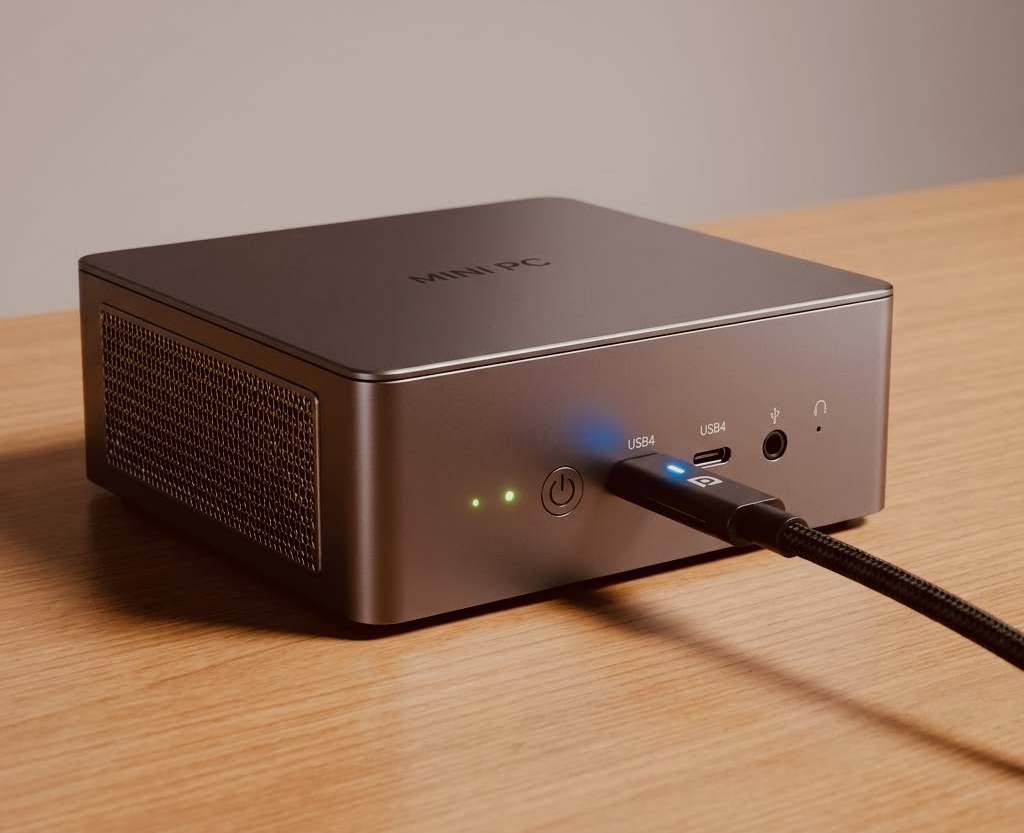
I’ve always learned best by building the thing, not reading about it, so this was a weekend project: stand up a production-grade observability platform on Kubernetes, on a single Minisforum UM790 Pro Mini PC, no cloud account, no monthly bill. The twist that makes it worth writing up is the app-of-apps pattern underneath it, the same GitOps foundation a real platform team runs, driving every piece from MetalLB up through the full mesh, three-pillar telemetry, and SLO-based alerting below.
The charts and config behind everything in this post are public in homelab-showcase. The working repos stay private, so this post carries the story the repo leaves out: why each decision was made, and what broke along the way.
Architecture: two ingress paths, one telemetry pipeline
k3s ships with Traefik as its own default ingress, and that’s still true here; there is no nginx anywhere in this cluster. Traefik and the Istio ingress gateway sit side by side behind two different MetalLB IPs, and they coexist permanently by design; neither one replaces the other. Rancher rides the Traefik path and is never meshed, no Istio sidecar, no telemetry from that side at all. Everything that goes through the Istio ingress gateway picks up an Envoy sidecar, and that sidecar is where every trace, metric, and log line actually originates.
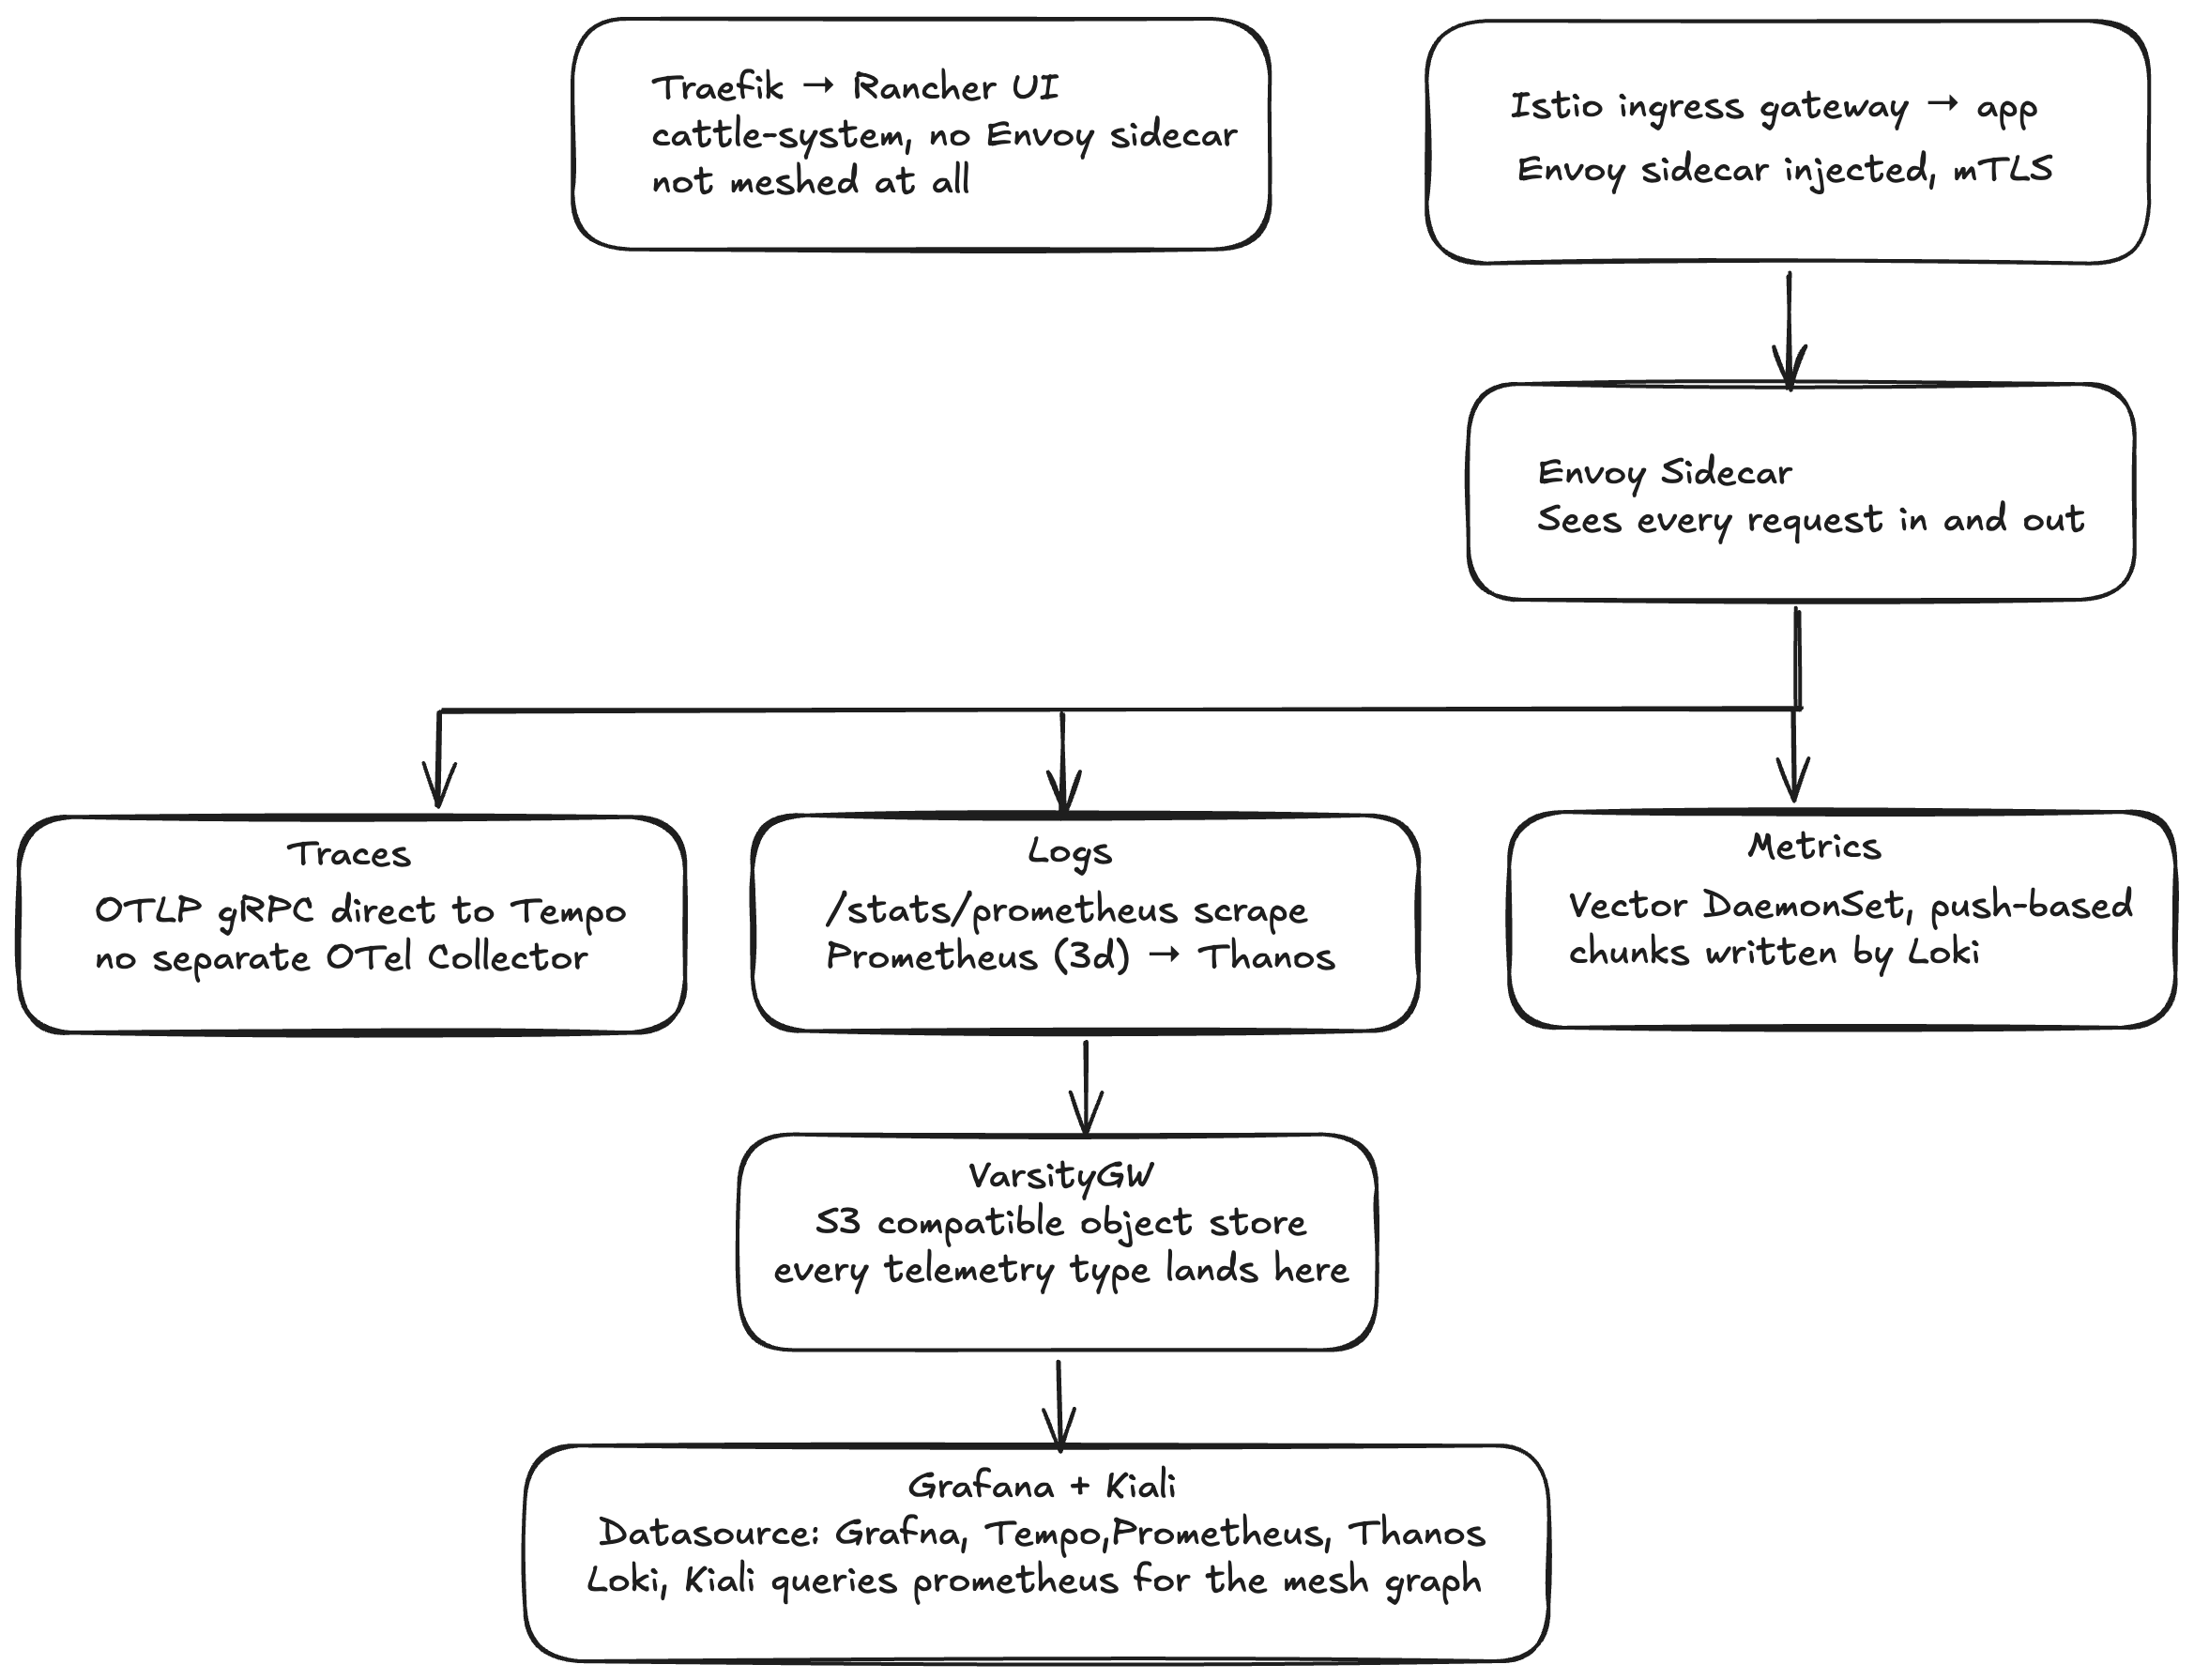
All three telemetry types converge on versitygw, the one long-term store, and get read back through Grafana and Kiali.
The Front Office: Traefik and Rancher
DNS for rancher.home.arpa resolves through Pi-hole to 192.168.2.220, a MetalLB-assigned IP. Traefik picks it up (it’s k3s’s own bundled ingress controller, not a separately-installed nginx) and forwards straight into Rancher’s UI and API in cattle-system. Nothing in that namespace carries an Istio sidecar, so from a mesh standpoint this whole path is invisible. It’s the management plane, not the workload plane, and it was never meant to show up in traces or the mesh traffic graph.
Think of it as the building’s front office: you badge in through it to manage the place, but it isn’t part of the production floor the rest of this post is about.
The Production Floor: Istio and the Mesh
*.lab hostnames resolve through Pi-hole to a second MetalLB IP, 192.168.2.221, straight to the Istio ingress gateway: Envoy on port 443. From there it’s Envoy talking to Envoy: every request lands on a pod that’s been through sidecar injection, wrapped in mTLS by default. Injection itself went out in two deliberate waves rather than everywhere at once, first narrow (gateway-routed traffic only), then everywhere it was safe to, carving out real exceptions along the way: hostNetwork pods, cert-manager, Rancher’s own namespaces, and later Prometheus itself, once its own sidecar turned out to be corrupting its own scrape data (more on that below).
The part worth sitting with: every one of those Envoy sidecars sees both sides of every call it handles. That’s not a side effect, it’s the mechanism the entire telemetry pipeline below is built on.
Picture a silent stenographer sitting in on every single meeting in the building, timing how long each one runs and writing down who showed up. That’s an Envoy sidecar, and it’s why the telemetry pipeline below doesn’t need a separate army of agents bolted on afterward.
Bookinfo: the app this whole pipeline gets tested against
Istio’s own canonical sample app runs through this path, and it’s a deliberate choice over a purpose-built HPA demo: it trades a guaranteed-clean CPU signal for something that actually exercises the rest of the mesh, real multi-hop tracing, a real Kiali topology, and later on, the SLI/SLO/burn-rate alerting this whole build was designed around. If the ingress, the mesh, and the telemetry pipeline all work, Bookinfo is where you’ll actually see it.
Telemetry: three pipelines, one destination
Three completely different conveyor belts, one warehouse at the far end.
Traces. Each Envoy sidecar exports OTLP over gRPC on port 4317 straight to Tempo, no separate OTel Collector sitting in between. Tempo’s own metrics-generator and its local-blocks processor back recent TraceQL queries; leave that component disabled (it is, by the chart’s own default) and a query like error finding generators: empty ring is what you get instead of results.
Metrics. Envoy exposes /stats/prometheus; istiod’s Telemetry API is what turns on the native stats filter that makes that endpoint meaningful. Prometheus scrapes it via PodMonitor/ServiceMonitor, label-gated discovery, so a monitor missing the exact right label is silently invisible, no error anywhere. Local TSDB retention is a 3-day bridge, not history; a Thanos sidecar and compactor ship every 2-hour block out before Prometheus would otherwise delete it (raw kept 5 days, downsampled 5m/1h blocks kept forever).
Logs. Vector runs as a DaemonSet, one pod per node, reading container stdout/stderr straight off the node’s filesystem and pushing, not scrape, into Loki, which writes its chunks out to versitygw.
All three land in the same place: versitygw, an S3-compatible object store sitting over a POSIX backend, is the one long-term store every telemetry type ultimately writes to. Grafana reads it back through four datasources, Tempo, Prometheus, Loki, and Thanos specifically for anything past local retention, like a 30-day view, and Kiali builds its mesh traffic graph by querying Prometheus directly.
Build order: what went in, and in what sequence
Everything below exists in the cluster because one Helm chart said so: app-of-apps turns a components: map in envs/lab/values.yaml into one ArgoCD Application per component, and every Application traces back to a single hand-applied Root. Nothing here was helm install-ed by hand past that first bootstrap step.
| # | Component | Role | Sharpest gotcha |
|---|---|---|---|
| 1 | app-of-apps | Renders one ArgoCD Application per component from values.yaml |
Tag-pinning trap: the Root’s targetRevision has to already contain the values change you’re pinning, or it silently renders the old file |
| 2 | ArgoCD | GitOps engine everything else deploys through | Same tag-pinning trap; GitHub org policy blocked deploy keys outright at one point |
| 3 | Hello | Smoke-test app | Proved a values change reaches the cluster with zero manual kubectl/helm |
| 4 | MetalLB | Bare-metal LoadBalancer, real external IPs | k3s’s built-in ServiceLB kept reappearing, a missing daemon-reload left the disable flag on disk but not in the running process |
| 5 | cert-manager + lab-ca | Self-signed internal CA | Every .lab hostname’s TLS traces back to this |
| 6 | versitygw | S3-compatible object store, backs Thanos/Loki/Tempo | Readiness probe had no TLS scheme once tls.enabled: true, a real upstream bug |
| 7 | Istio | Service mesh: mTLS, routing, telemetry generation | istio_requests_total missing for weeks, istiod only reads the first mesh-wide Telemetry resource per namespace and silently ignores a second one |
| 8 | argocd-gateway, versitygw-gateway | Per-service Istio exposure pattern | Set the template every later -gateway chart repeats |
| 9 | Kiali | Mesh topology / traffic-graph UI | Traffic graph came up empty, Prometheus’s own sidecar was corrupting Prometheus’s own scrape data under the wrong pod identity |
| 10 | kube-prometheus-stack | Prometheus, Alertmanager, Grafana, kube-state-metrics | Prometheus Operator’s CRDs were too large for a normal ArgoCD sync, three compounding causes, all had to be fixed together |
| 11 | grafana-gateway | Grafana’s external exposure | n/a |
| 12 | Tempo + istio-tracing | Distributed tracing | error finding generators: empty ring, metrics-generator disabled by the chart’s own default |
| 13 | Loki + Vector | Log aggregation and shipping | Vector replayed its entire on-disk backlog on first boot, tripping Loki’s rate limits so hard that zero lines landed despite everything reporting healthy |
| 14 | Thanos | Long-term metrics beyond local retention | No maintained free Helm chart exists at all; a retention crash-loop established the rule that cluster-specific policy belongs in the values layer, never the chart’s own defaults |
| 15 | istio-monitors | PodMonitor/ServiceMonitor for the mesh’s own metrics | Same label-gated discovery gotcha as everywhere else, wrong label, silently invisible |
| 16 | istio-injection | Namespace-labeling policy for sidecar scope | Implements the two-wave injection rollout |
| 17 | Bookinfo | Istio’s canonical sample app + HPA demo | ContainerResource metric type needed to exclude the sidecar’s own CPU from the HPA signal |
| 18 | Grafana image-renderer | PNG panel exports | Same token-generation fragility as Grafana’s own admin password bug |
| 19 | OpenBao + External Secrets Operator | Secrets management, migrated one credential at a time | Single-operator homelab means the unseal key sits in a plain Kubernetes Secret. The security boundary is honestly no stronger than Secrets already were, but it buys centralized management and audit logging |
The throughline across nearly every row: a label-gating rule, a values-layering rule, or a chart-vs-cluster-policy rule that got established once and then held for everything built afterward, not a pile of unrelated one-off bugs.
Bootstrapping it: two manual commands, then GitOps takes over forever
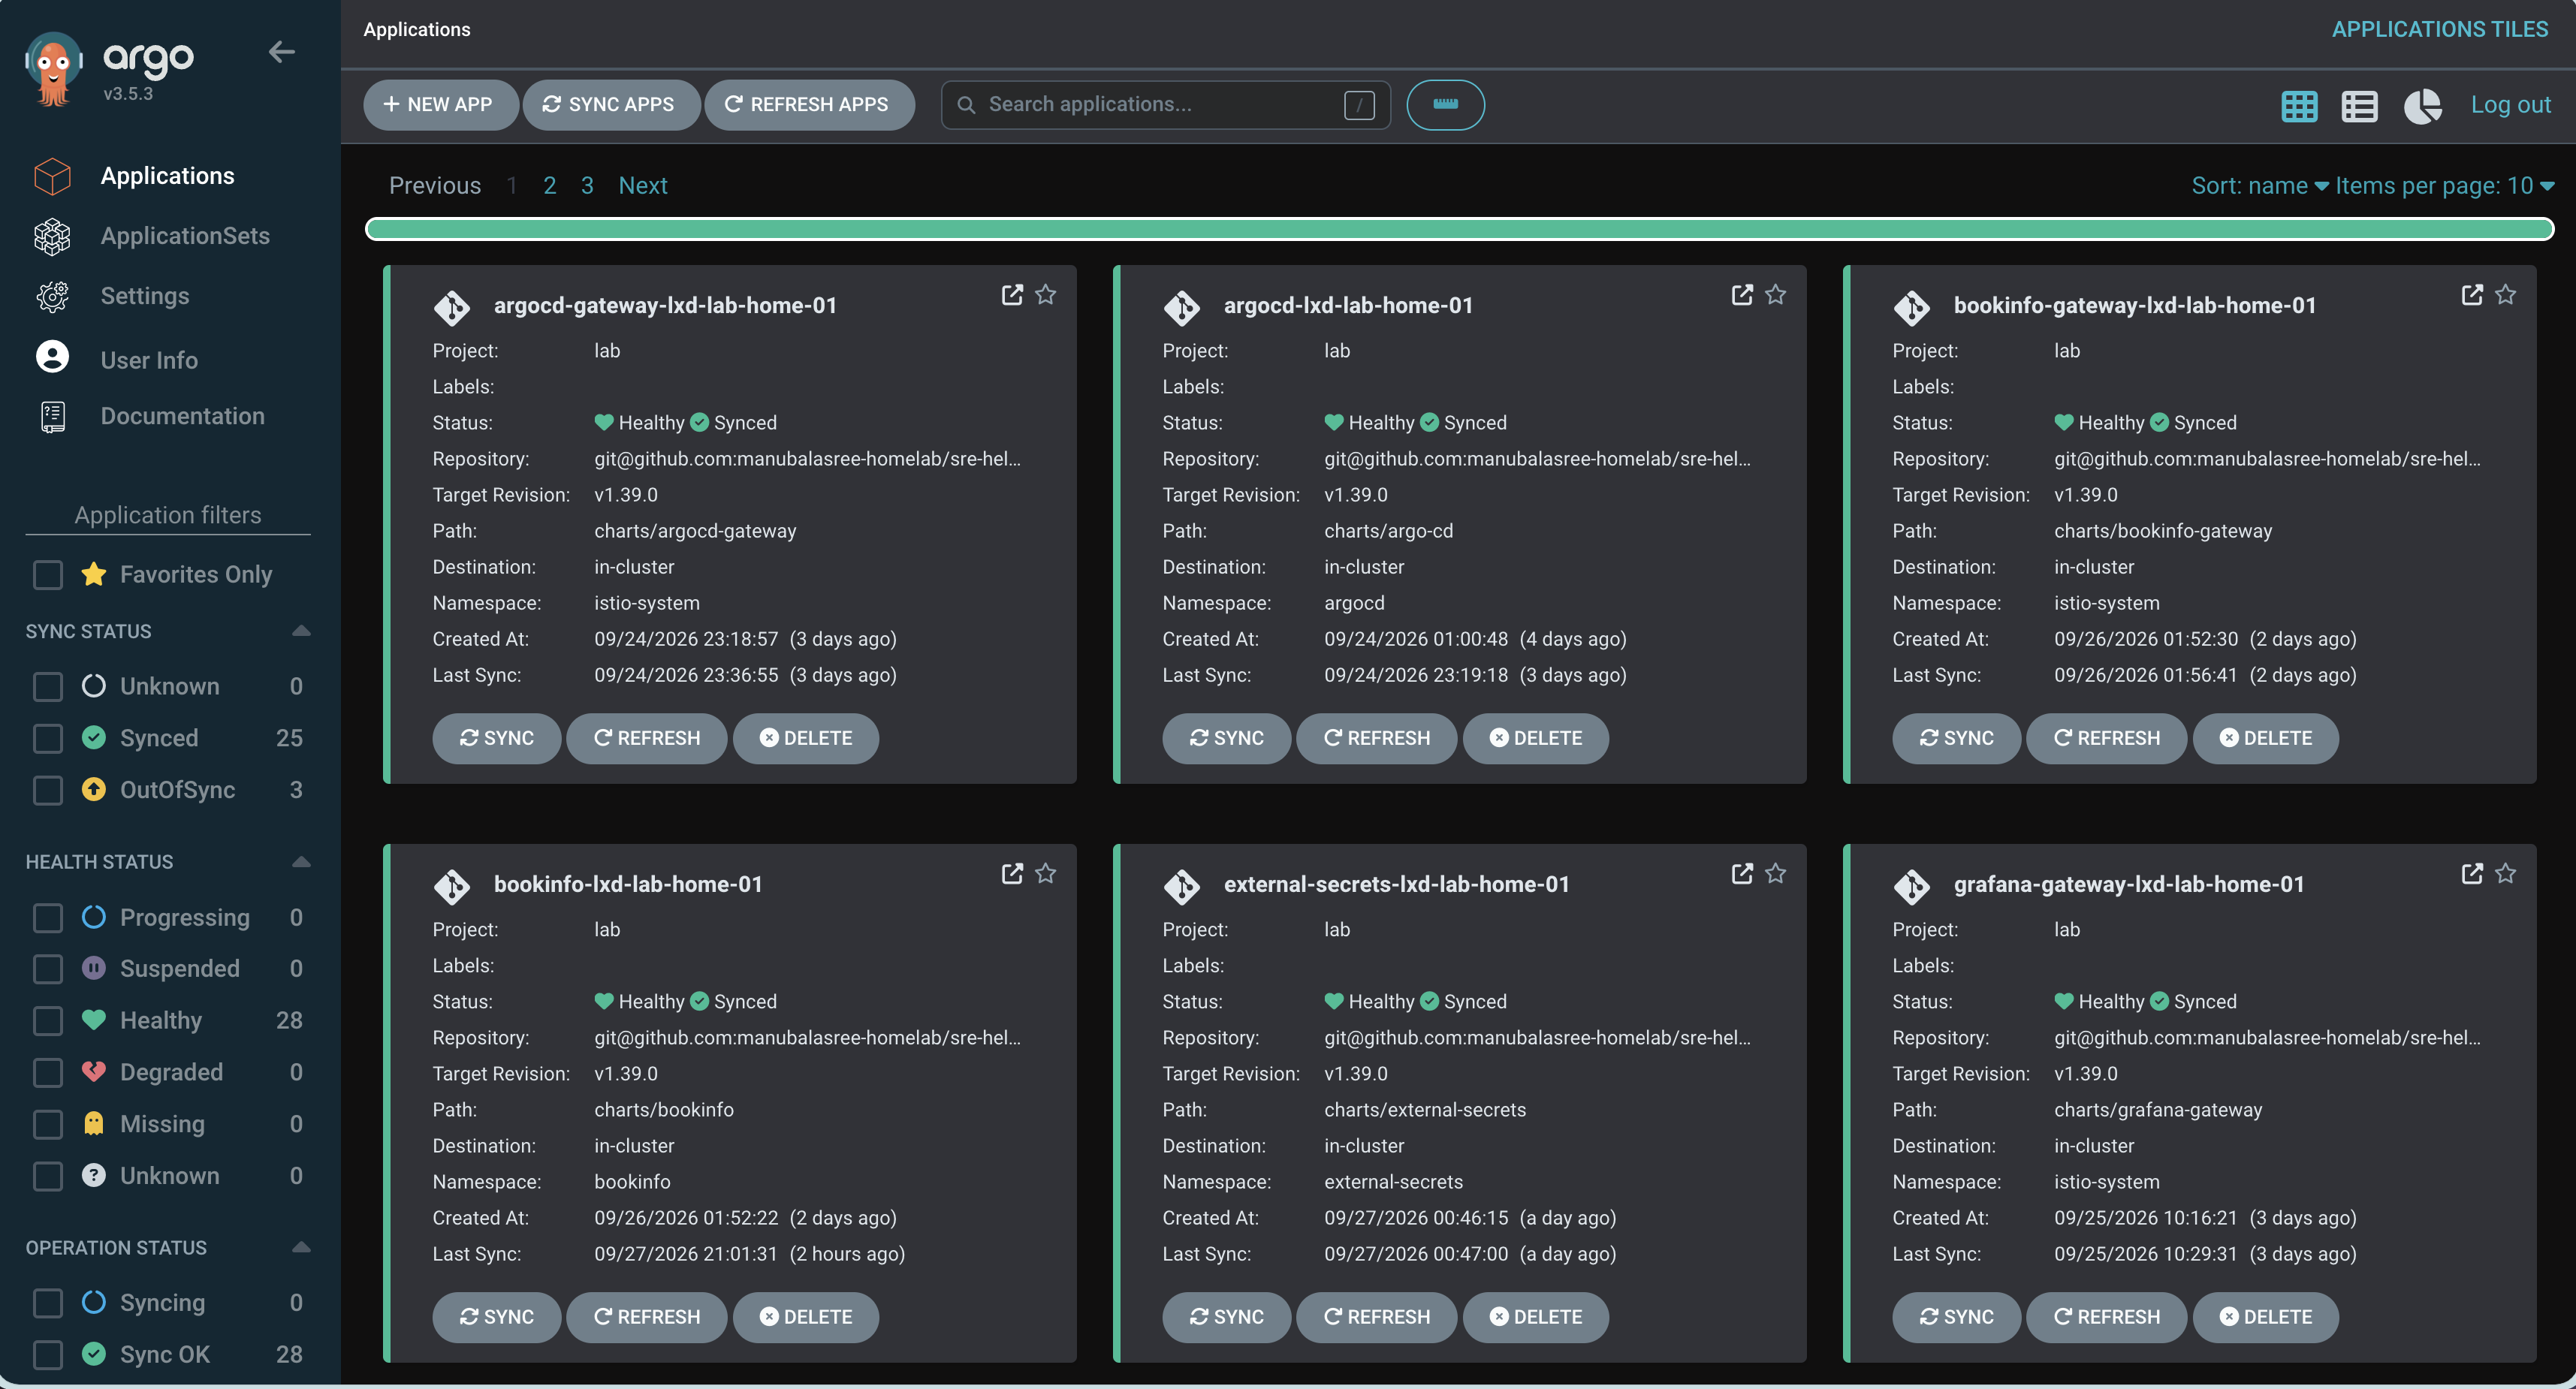
GitOps has a chicken-and-egg problem at the very start: ArgoCD is what watches the git repos and applies whatever it finds, but ArgoCD itself can’t GitOps itself into existence before it exists. So there are exactly two commands run by hand, once, ever:
helm upgrade -i --atomic --timeout 20m --history-max 5 argocd argo/argo-cd -f bootstrap/argocd/values.yaml -n argocd --create-namespace --version 10.9.2
kubectl apply -f bootstrap/roots/lxd-lab-home-01.yaml
The first is an ordinary Helm install of ArgoCD, upgrade -i instead of plain install on purpose, so it’s idempotent and safe to rerun if a machine, not a person, ever needs to (a full cluster rebuild, say). The second applies the Root: one ArgoCD Application pointed at the app-of-apps chart. That single kubectl apply is the last manual step in the entire system: from that point on, ArgoCD renders envs/lab/values.yaml into one Application per component and reconciles all of them itself, polling every 3 minutes or so, no webhook required. A values change proved this live: a replicaCount bump got pushed to git, and about three minutes later, with nobody running helm or kubectl, the pod count changed on its own.
The one genuinely clever bit is how ArgoCD adopts itself: the argocd Application’s Helm release name and namespace are set to match the manual install exactly, so when ArgoCD starts managing that component it reconciles the same release instead of standing up a conflicting second one. Same name, same namespace: it adopts, it doesn’t duplicate.
Why the automation needs its own machine on the LAN. The bootstrap commands are also wrapped in a GitHub Actions workflow, but GitHub’s own hosted runners have no route to a private 192.168.2.x network, so a dedicated VM (rancher-controller) runs the Actions runner agent as a background service and the workflow targets it by label. Worth being honest about: that turns anything able to push to the repo, or trigger the workflow, into something with code execution on a machine that has network access to the cluster, a real security surface, not just a config detail, and one to revisit before ever making the repo public or adding collaborators.
Versioning runs on commit messages, not manual tags. Both repos run semantic-release on every push to main: a feat:/fix:/feat!: prefix on the commit decides the next version and cuts a GitHub release automatically, a commit without one of those prefixes is silently skipped, no version bump, no error. The two repos’ version pins don’t live the same way, though, and that’s worth getting right:
| Where it’s pinned | Why | |
|---|---|---|
sre-helm’s revision |
A value, sreHelm.revision in envs/lab/values.yaml |
The chart reading it is already checked out at a known revision, so pointing at another repo’s tag from inside it is safe |
sre-gitops-bootstrap’s own revision |
Hardcoded, the Root’s spec.source.targetRevision |
Self-reference: the Root has to know which revision to fetch before it can read any values file telling it which revision to use, a values field can’t express that |
Getting the sequencing backwards here is the easiest way to quietly break this pattern: the Root’s targetRevision has to point at a tag that already contains whatever values change is being pinned, or it keeps rendering the old file and looks like nothing happened.
SLI, SLO, SLA, and burn-rate alerting, done properly on Bookinfo
The availability SLI (the 5xx one) is the plain productpage success ratio, response_code !~ "5..", scoped to productpage-v1, the one user-facing entry point. reporter="destination" is required, or Istio’s dual-reporting (both sides of the sidecar report the same request) double-counts every single one. This is the SLI the burn-rate alerting below is built on.
SLO (99.5%) vs. SLA (99%) are deliberately different numbers, not a typo. The internal target is tighter than the external promise on purpose, so alerts fire before the SLA is actually breached, not at the same instant a customer would notice. Error budget is just 1 − SLO, kept as an explicit values.yaml constant rather than computed in a template.
Burn-rate alerting follows the Google SRE Workbook’s multi-window pattern: a fast tier (1h window over 5m, 14.4× burn, pages), a slow tier (6h over 30m, 6×, pages), and a ticket tier (48h over 4h, 1.5×, opens a ticket), all routed through the Alertmanager → Slack pipeline that already existed, nothing SLO-specific bolted onto Alertmanager itself. The load-bearing gotcha in the whole design: the textbook ticket tier uses a 3-day window, and this cluster’s Prometheus retention was 2 days at the time, a 3-day rate() would have silently seen less data than it claimed to, not errored out. The window shrank to 48h and the multiplier got recomputed from 1× to 1.5× to preserve the same “10% of the 30-day budget” meaning. Retention has since moved to 3 days; the window wasn’t retroactively widened back, a known, deliberately deferred cleanup, not an oversight.
The three tiers are basically smoke detectors set to different sensitivities: the fast one screams the instant something’s clearly on fire, the ticket tier just wants someone to go check on that faint burning smell before it turns into one.
One detail worth keeping: the burn-rate multipliers don’t depend on the SLO percentage at all, only the absolute error rate each tier trips at does. Changing the SLO later means changing one errorBudget constant, not touching the alert math.
Two p99s, because one of them was lying to me. Latency is the second SLI, and the first recording rule I wrote for it computes p99 from istio_request_duration_milliseconds_bucket, grouped by destination_workload, so dashboards and alerts don’t recompute a histogram quantile on every query. It’s great for debugging, which service in the chain is slow, but it was never the right number to call the p99 SLI. It mixes productpage, details, reviews, and ratings together, and a customer never calls details or reviews directly. They only ever hit productpage, whose own latency already includes whatever it waited on internally. I only caught that by asking how a customer would actually experience p99.
So there’s a second recording rule, identical in shape but scoped to productpage-v1. That’s the customer-facing SLI: the per-workload rule answers why it’s slow, the productpage rule answers whether a user felt it.
The classic gotcha applies to both: rate() is a window relative to now, so with no recent traffic every bucket’s rate is zero, and histogram_quantile over all-zero buckets is a 0÷0 division. You get nan, not a stale-but-valid old number. Hit that live, twice.
Latency SLO (140ms) vs SLA (200ms) follows the same “SLO tighter than SLA” logic as availability, but deliberately stays dashboard-only: direct millisecond thresholds on the productpage p99, no error budget, no burn-rate alert. A raw percentile isn’t additive the way a good/bad ratio is, so the availability burn-rate math doesn’t transfer. If latency ever becomes real alerting, the SRE Workbook’s answer is to reframe it as a ratio, the fraction of requests faster than the threshold, rather than burn-rating a percentile directly.
The Grafana SLO row has five panels: productpage p99 against the 140ms SLO and 200ms SLA thresholds, current burn rate, 30-day availability against both availability thresholds, burn rate over time with dashed threshold lines, and error ratio across all six windows.
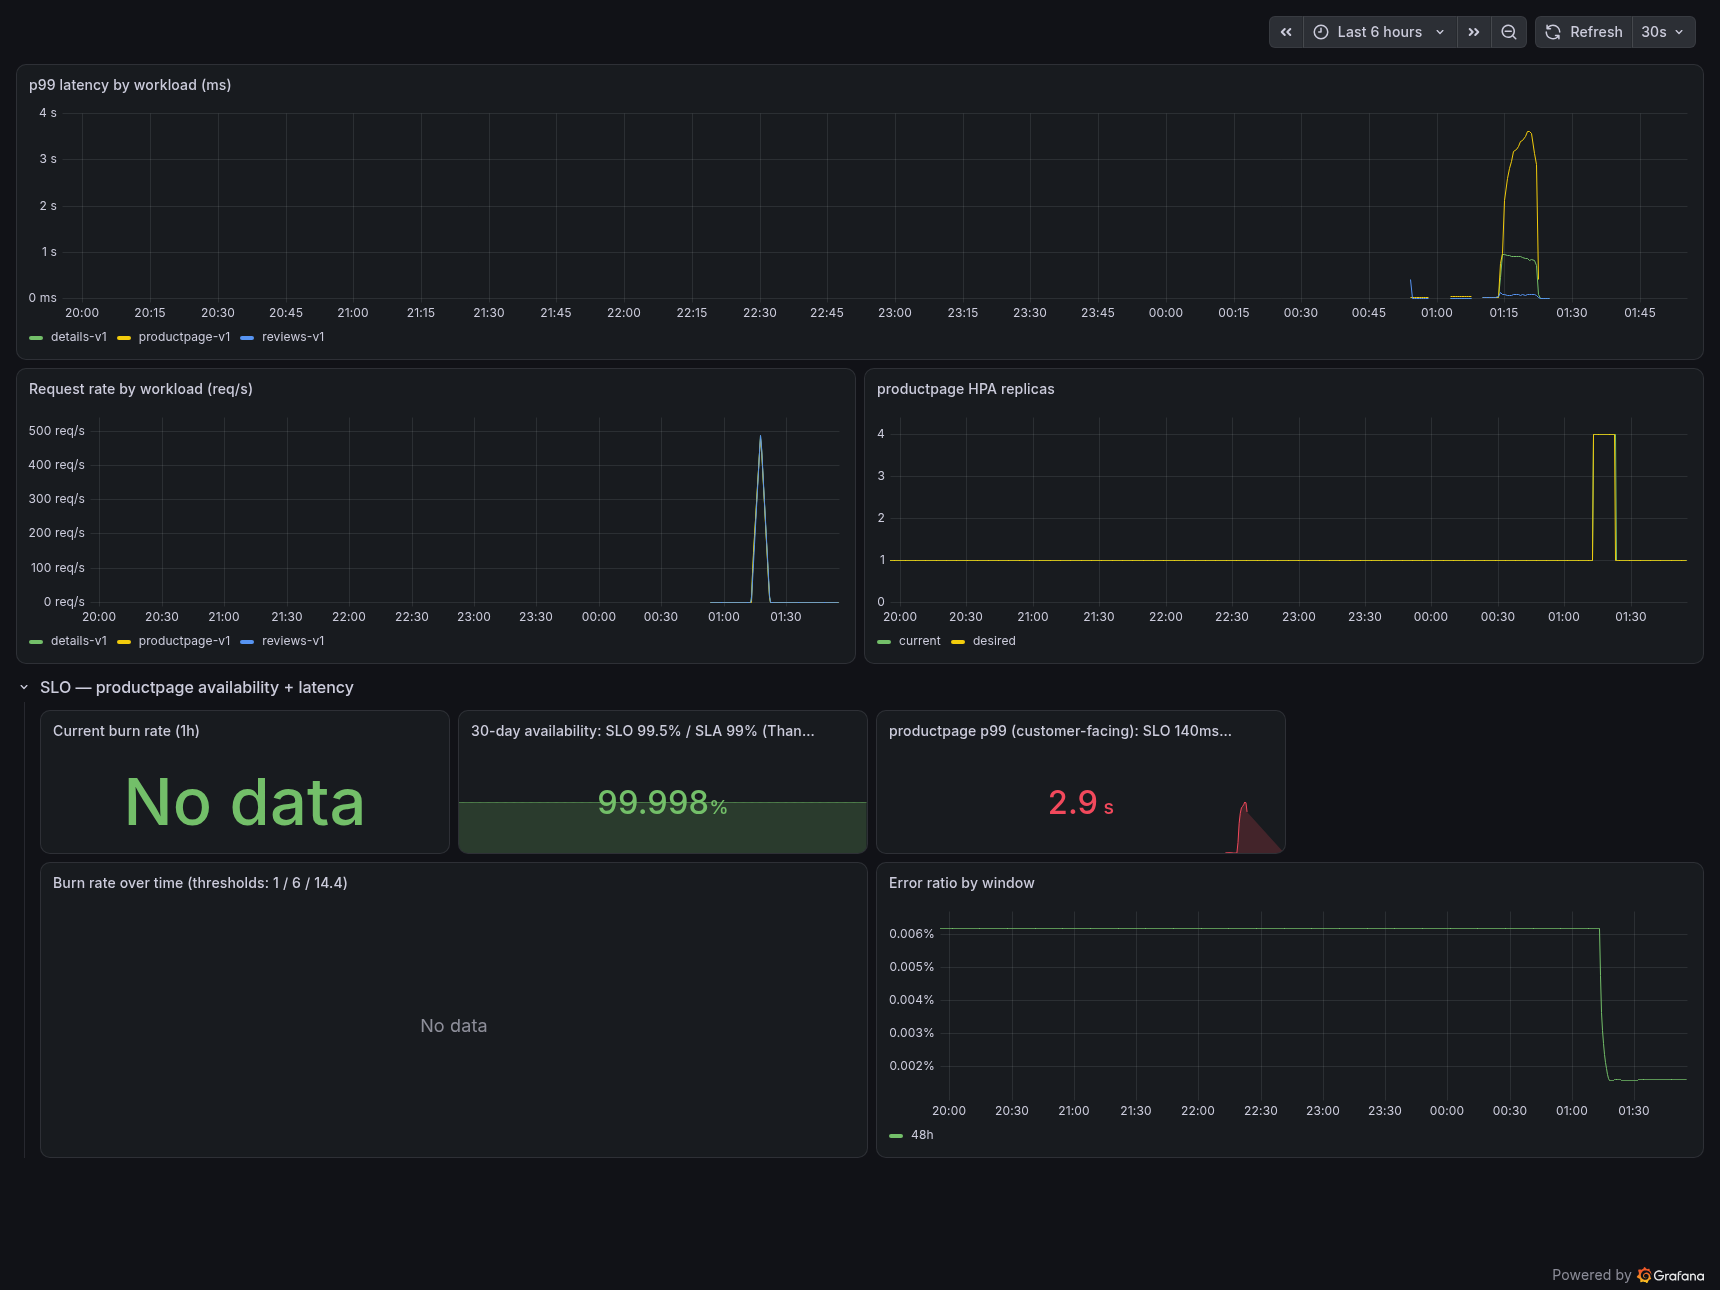
The 30-day panel is the one place in this whole build where Thanos, built as generic long-term-storage infrastructure, gets directly consumed by something else instead of just sitting there: local Prometheus retention doesn’t hold 30 days, so that panel has to go through Thanos specifically.
What this honestly isn’t, yet
There’s a distinction worth being precise about: this project has enterprise-caliber practice, real design decisions, real postmortems, real GitOps discipline. It does not have enterprise-grade infrastructure, which a single homelab node genuinely can’t claim. The gap list, kept deliberately as a gap list and not a roadmap:
- SSO/OIDC via Keycloak for ArgoCD, Grafana, and Kiali, all three currently run basic or anonymous auth. Keycloak specifically, self-hosted, so it stays a zero-cloud-cost project and speaks OIDC natively to all three without a separate identity system per tool.
- AuthorizationPolicy / RequestAuthentication, mTLS is live everywhere a sidecar exists, but nothing enforces who may call what yet. Today’s zero-trust story is “encrypted,” not “access-controlled”; the prerequisite (real workload identities via sidecars) is done, the policies aren’t.
- RBAC beyond the defaults, ArgoCD’s AppProject/RBAC and Kubernetes RBAC both exist but haven’t been narrowed, waiting on Keycloak’s group/role mappings to actually authorize against.
- Disaster recovery, HA control plane, real capacity headroom: no backup/restore story for etcd or any local PVC, and this node runs hot rather than carrying spare capacity as a baseline.
- Runbooks: the incident log documents root causes in real detail, but isn’t yet written as “if X happens, do Y” that a second on-call engineer could follow cold.
- Image signing / SBOM: vendored charts are version-pinned and reviewed, but nothing verifies the container images themselves.
- Resource footprint only works because the box is oversized: sidecars on every pod, plus Prometheus, Thanos, Loki, Tempo, Vector, and ArgoCD, all fit comfortably because the UM790 Pro runs 64 GB of DDR5. Try this on a 16 GB NUC or a Raspberry Pi cluster and the memory tax from Envoy sidecars, TSDB compaction, and Vector’s buffering forces aggressive limits or OOM kills fast.
- Classic sidecars, not ambient mesh: Envoy sidecar injection over Istio Ambient’s
ztunnelor Cilium eBPF, on purpose. Sidecarless data planes cut per-pod proxy overhead, but on a single node, the per-pod memory cost was worth it for deterministic L7 header manipulation, W3C trace context injection, and mTLS troubleshooting entirely in user space, no kernel dependencies to debug. - versitygw is a single point of failure: it backs Thanos, Tempo, and Loki from one local instance over a POSIX filesystem, no replication, no distributed durability. That’s fine for emulating an S3 API without cloud egress costs, but a real production tier would need Ceph, distributed MinIO, or an actual cloud object store instead.
Why bother with any of this
None of this needed a cloud bill. A single mini PC, a k3s cluster, and a habit of thinking through the tradeoffs before making a decision got the ingress layer, the mesh, the full three-pillar telemetry stack, SLO-driven alerting, and the beginning of a real secrets story, all wired together the same way a production platform team wires them, gotchas and postmortems included. The gap list above is exactly that: gaps. Knowing precisely where the edges are is what “production-style, with tradeoffs” is supposed to mean.
Writing down the root cause next to the code that caused it, as it happens, not after the fact, is the habit most worth copying here, even before any specific tool choice.
Explore the code, and what’s next
Everything running in this post is in homelab-showcase: the app-of-apps root and bootstrap in sre-gitops-bootstrap/, and every Helm chart and values file in sre-helm/, including Bookinfo with its SLO/SLA alerting. Start with CONTEXT.md and ROADMAP.md inside sre-gitops-bootstrap/.
Next up is closing the gap that matters most: Keycloak for SSO and real AuthorizationPolicy rules, so the mesh goes from “encrypted” to “access-controlled.”